Measuring Integration ROI in EdTech Products
Most institutions care about EdTech ROI but lack the systems to measure it.
How Poorly Institutions Currently Measure What They Spend on EdTech
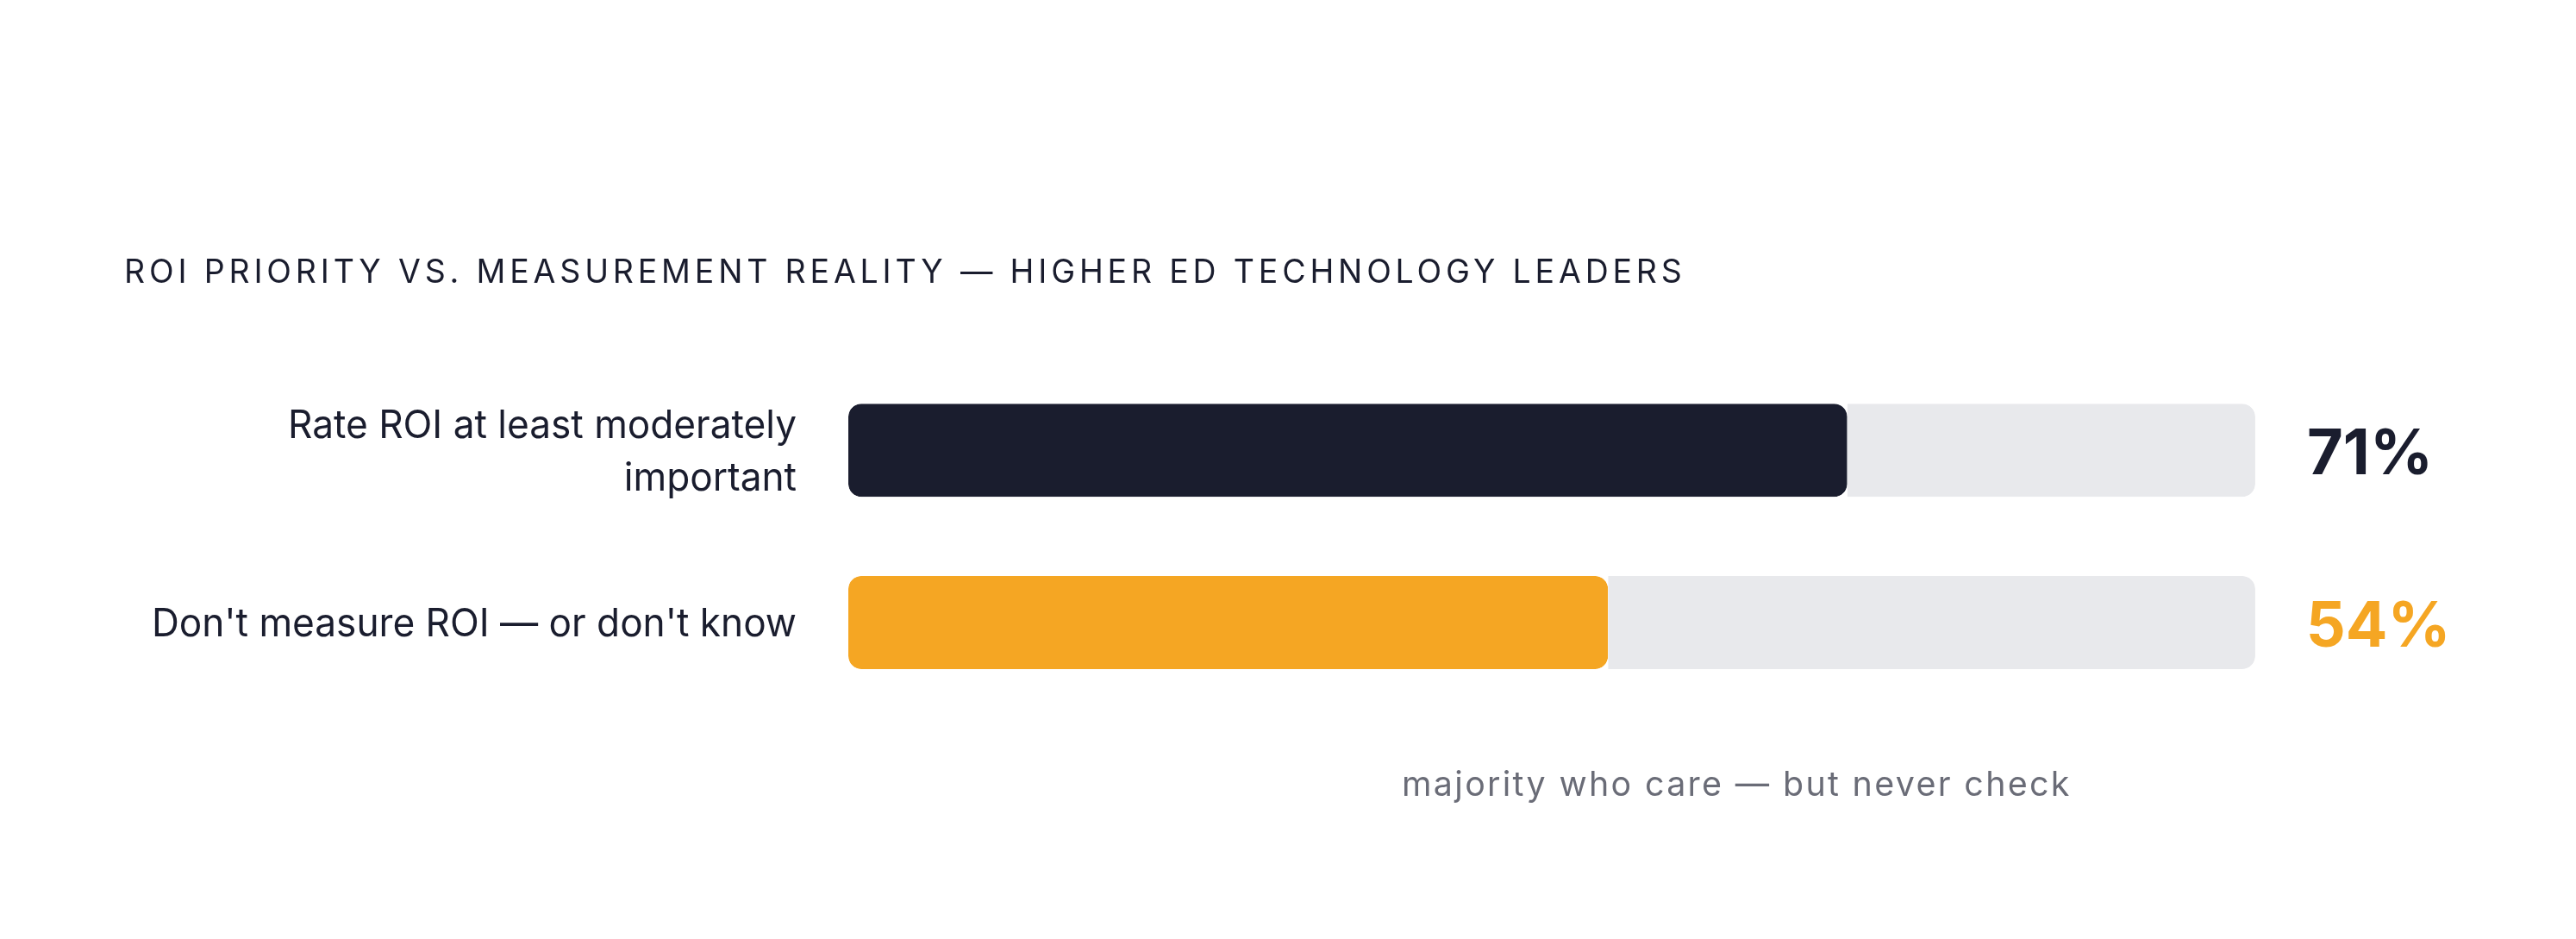
The measurement problem isn't indifference. A September 2025 EDUCAUSE QuickPoll of 124 higher education technology leaders found that 71% rated ROI as at least moderately important, yet 54% said their institution either doesn't measure it or they have no idea whether it does. Not a small gap, not a rounding error. A majority of institutions that claim to care about EdTech accountability have no mechanism for exercising it. That's not a knowledge failure. It's an infrastructure failure, and it has persisted across procurement cycles, leadership changes, and platform overhauls with essentially no meaningful correction.
The downstream consequences are concrete. According to EDUCAUSE's "2024 EDUCAUSE Horizon Report," an estimated 40% of EdTech budgets go to unused or underutilized tools, and only 34% of institutions regularly analyze software usage data. Institutions want accountability for their technology spending but lack the data plumbing to act on it.
Where this becomes genuinely damaging is at the intersection with integration. General EdTech ROI asks whether a product delivers learning or operational value. Integration ROI asks a different question entirely, whether the connective tissue between that product and the institution's existing systems is functioning, defensible, and worth maintaining. Conflating them produces measurements that answer neither question well, and in practice, that conflation is the norm.
Why Integration ROI Is Harder to Measure Than General EdTech ROI
EdTech ROI already spans three genuinely difficult-to-reconcile categories: academic outcomes, operational efficiency, and reputational value. Each requires different data sources, different stakeholder perspectives, and a different measurement apparatus. Every institution I've seen try to tackle this lacks the apparatus to triangulate all three simultaneously. Integration adds a fourth layer that neither buyers nor vendors reliably account for, and it's the layer that blows up the model quietly, usually long after the contract is signed.
An integration is simultaneously a cost center, absorbing engineering time, maintenance cycles, and compliance overhead, and a value multiplier that generates product stickiness, accelerates onboarding, and improves data quality. Those two realities pull against each other within any standard model. Collapsing them into a single line item obscures both.
There is also what I'd call the hours-saved trap. Every project I've reviewed measures integration value by estimating staff time displaced, which is a reasonable instinct and incomplete in ways that compound quietly. According to Campus Technology's "The Hidden Cost of EdTech Integration Failures" (2023), a study of 200 higher education institutions found that poorly integrated tools decreased faculty productivity by an average of 23 minutes per person per day. Across a faculty of several hundred, that aggregate loss is enormous and completely invisible in standard procurement analysis. Nobody is tracking it, and no budget line captures it. It just disappears into the institutional atmosphere.
The Scale of the Interoperability Problem EdTech Vendors Are Actually Navigating
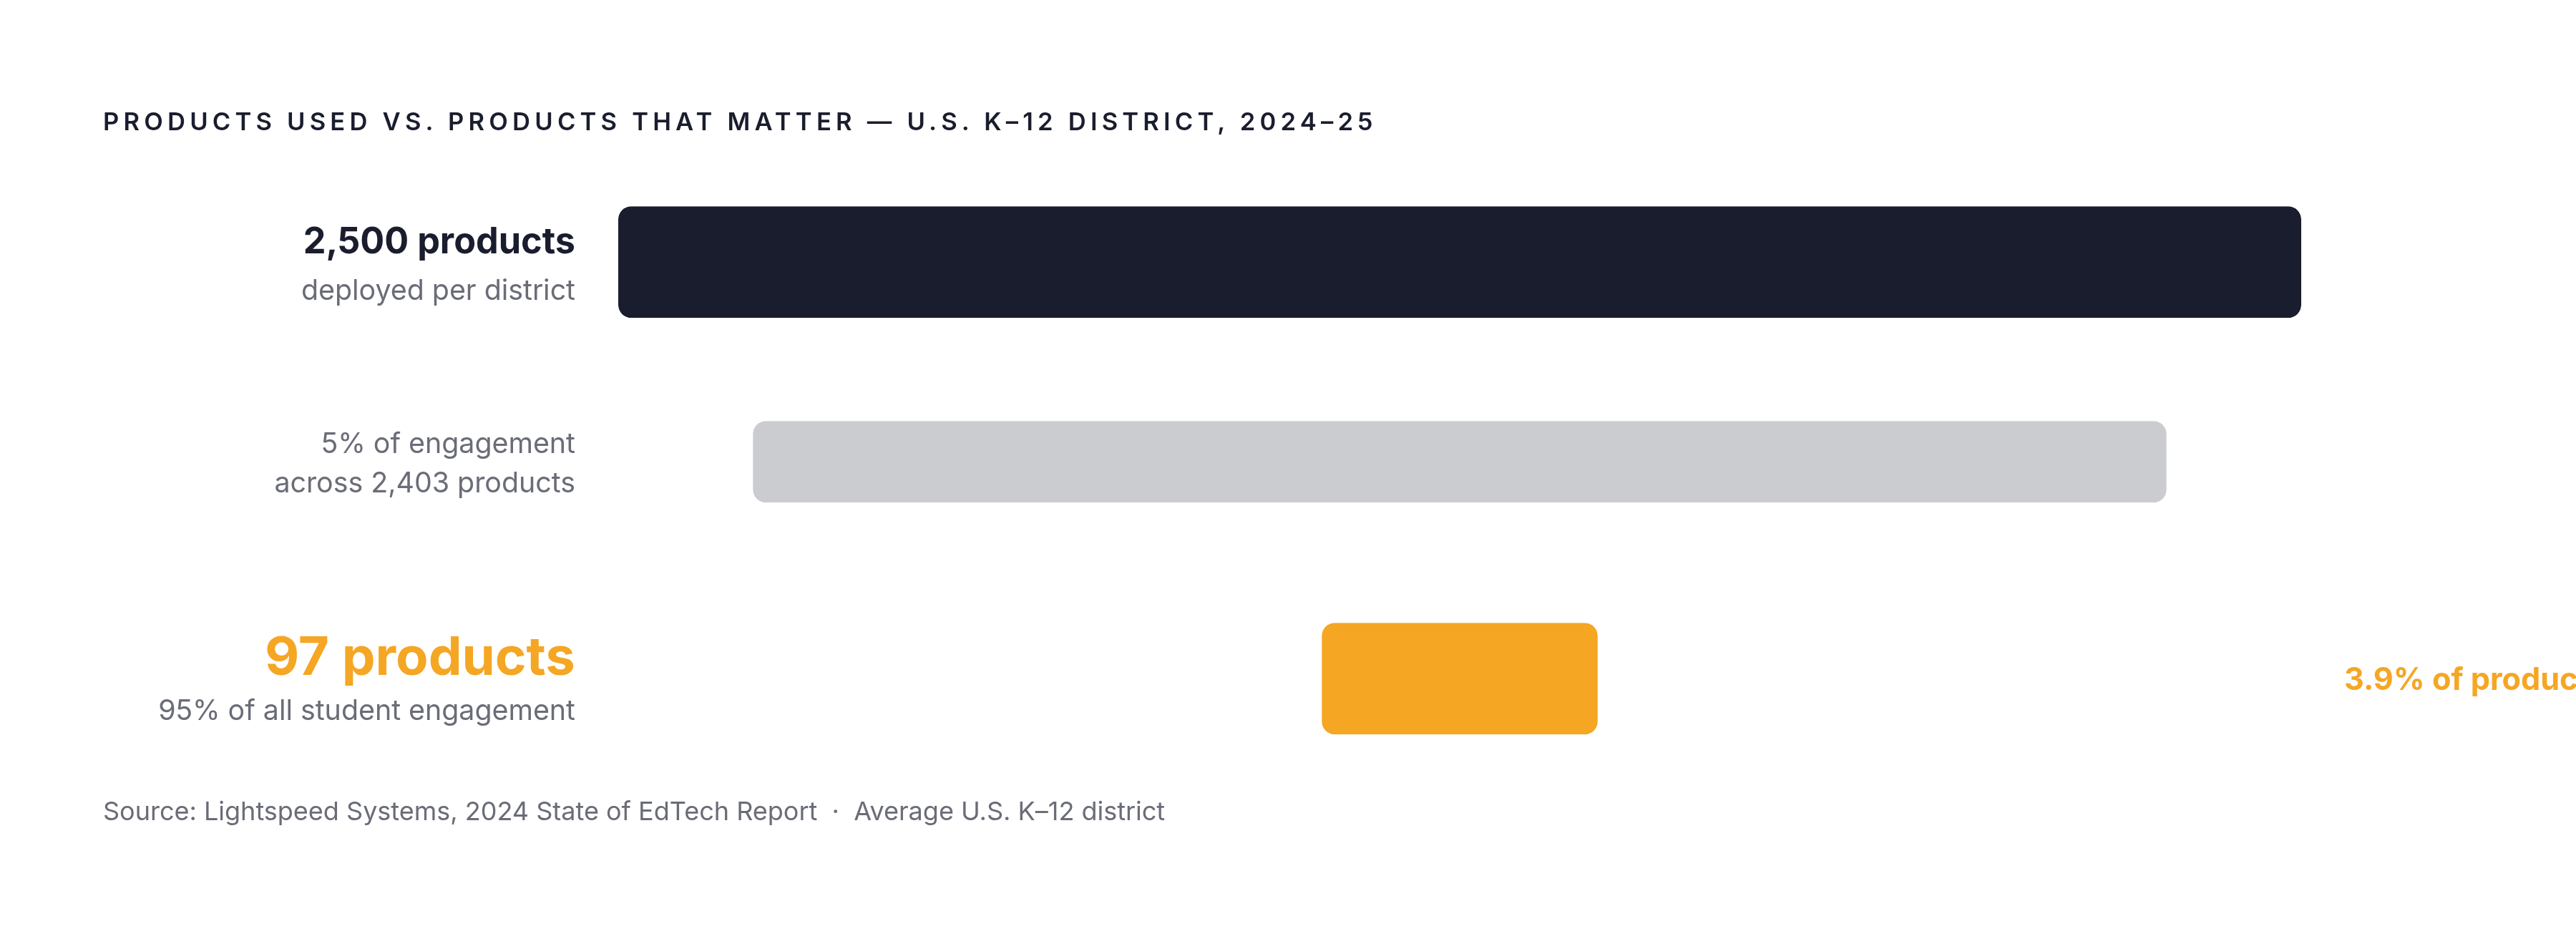
The complexity vendors face is specific, and it is routinely underestimated from the outside. According to LearnPlatform's "EdTech Top 40" (2024), the average U.S. K-12 district used approximately 2,500 distinct EdTech products in the 2024-2025 school year. The typical higher education institution maintained 900 or more active applications (EDUCAUSE, "2024 EDUCAUSE Horizon Report," 2024). These aren't curated stacks. They are accumulated artifacts of successive procurement cycles, grant-funded pilots, and departmental autonomy operating without central coordination. Any vendor entering that environment is not joining a system; they are joining a bureaucratic sediment layer.
Data from Lightspeed Systems clarifies the vendor's actual position within that environment: across all those applications, only 97 products accounted for 95% of actual student engagement in 2024 (Lightspeed Systems, "2024 State of EdTech Report"). The long tail is largely waste. Any vendor outside that core group of 97 faces existential risk, and the path into it runs through deep integration, not feature novelty. Strong products lose renewals to weaker ones because they haven't built the connective tissue that makes removal politically and operationally costly.
The standards required to close enterprise deals in 2026 are specific: OneRoster 1.2 with gradebook passback, LTI Advantage for single sign-on, Clever sync, and Ed-Fi v7 for state reporting. Missing any single one can lose the deal. Achieving LTI Advantage and OneRoster certification is no longer a differentiator; it's a procurement prerequisite for large district and university sales. The vendors who missed that transition didn't miss it in one decisive moment. They missed it incrementally, quarter by quarter, until the deals simply stopped closing.
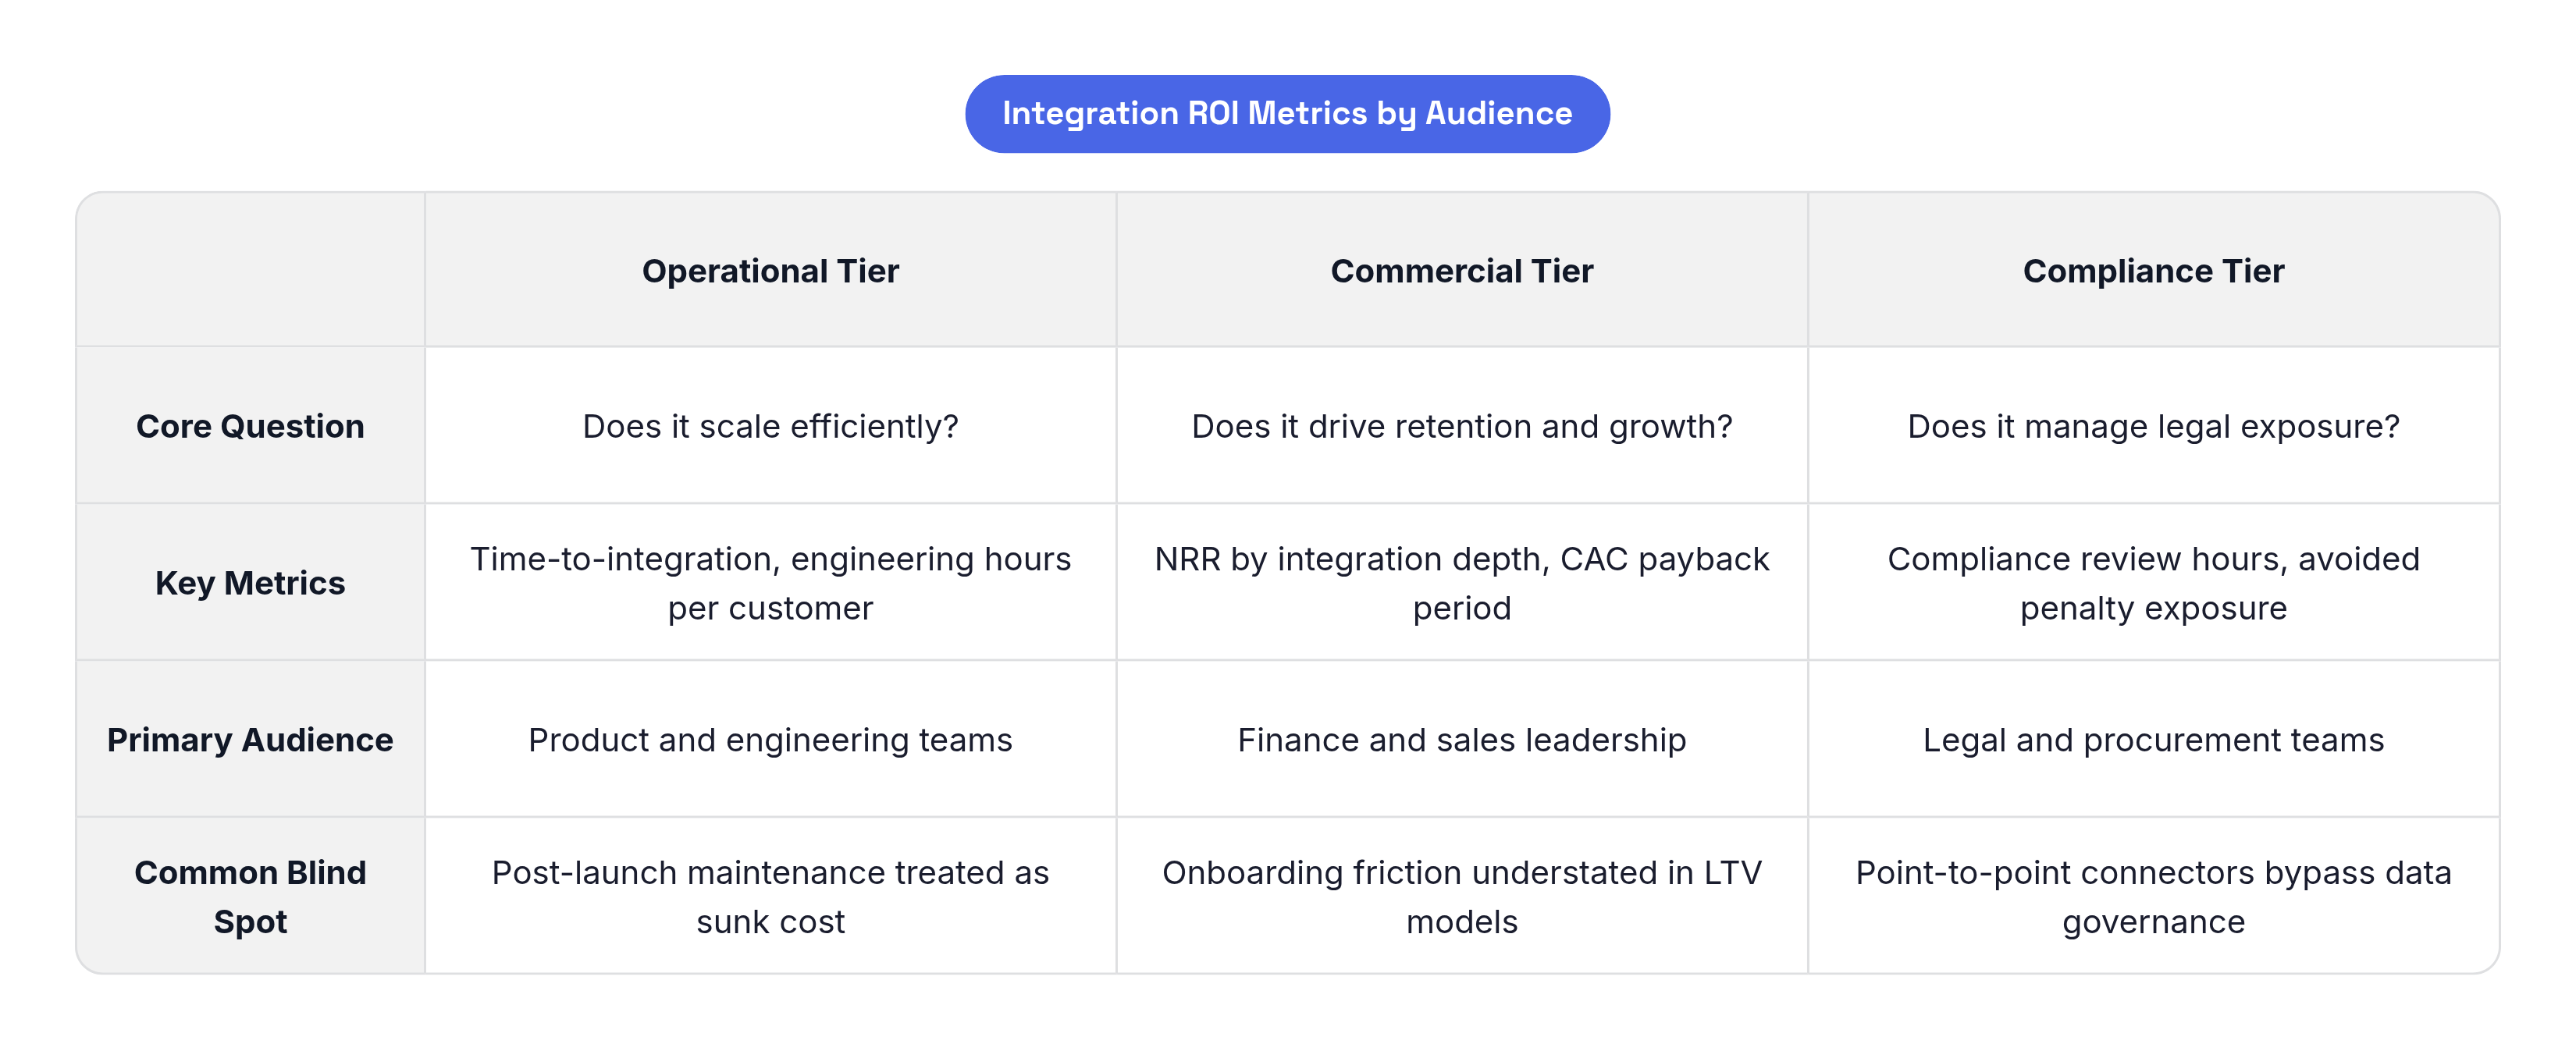
Ongoing maintenance compounds the cost picture further. Supporting a single LMS integration typically demands 5 to 10 hours of senior engineering time per month at market rates of $100 to $200 per hour. Every ROI model I've examined treats post-launch maintenance as a sunk cost or ignores it entirely. It is a recurring operating expense that silently erodes the economics of every customer relationship it touches.
Time-to-Deployment and Engineering Hours as the First Tier of Integration ROI Metrics
The first tier of integration ROI is operational: how long it takes, how much it costs, and whether that cost structure scales as the customer base grows.
Building a multi-standard integration architecture from scratch typically requires six to twelve months of focused engineering work. The investment is front-loaded and substantial. Once built, however, new customer onboarding shifts from bespoke integration projects to configuration exercises, and that transition is where the ROI compounds. Each subsequent customer absorbs dramatically less engineering cost than the first, which changes the economics of growth in ways that standard product cost models don't capture.
According to IMS Global Learning Consortium's "Interoperability Impact Report" (2025), institutions that migrated from on-premises systems to cloud interoperability platforms reported a 31% reduction in IT operational costs related to data integration and a 40% improvement in time-to-integration for new applications. Those are structural shifts in the economics of customer delivery, not marginal efficiency gains.
The metrics that capture this tier are trackable: time from contract signature to live integration, engineering hours per new customer integration, the ratio of configuration work to custom development work, and monthly maintenance hours per active connector. Tracked over time and across customer cohorts, these numbers reveal whether the integration model is actually scaling or whether each new customer is still consuming disproportionate engineering resources, a distinction that matters enormously when you're trying to justify platform investment to a board.
The build-versus-buy decision materially changes these numbers. According to EdSurge's "Build vs. Buy: The Real Cost of EdTech Integrations" (2024), analysis of more than 50 EdTech projects found that choosing between custom LMS integration and a managed third-party API can shift the project budget by over $100,000. Every hour of integration maintenance handed off to a managed connector is an hour of product development recovered. That should be tracked as opportunity cost, not merely as a line-item saving, because the framing changes how the investment reads to a finance team.
Retention and Renewal Metrics Where Integration Depth Shows Its Commercial Value
The commercial case for integration depth is most visible in retention data. B2B EdTech annual retention averages 85%, compared to roughly 40% for B2C (ChurnZero, "SaaS Retention Benchmarks," 2024). That gap isn't primarily a product quality story. It's an integration depth and switching cost story. A product embedded in the LMS gradebook workflow, the rostering pipeline, or the SIS reporting chain is structurally harder to remove than a standalone tool, regardless of feature parity between the two.
EdTech loses 15 to 25% of school contracts every June as budget cycles reset. Monthly churn in weaker products runs 9 to 10%, against a best-practice target of under 2% for SMB accounts and under 1% for enterprise (Andreessen Horowitz, "EdTech Market Analysis," 2024). The difference between a vendor that survives those June purges and one that doesn't often comes down to whether the product has become load-bearing infrastructure for the institution, something they'd have to actively dismantle rather than simply choose not to renew.
LTI grade passback is the linchpin of that structural stickiness. Manual grade entry is friction that instructors won't tolerate at scale. A vendor that eliminates it becomes part of the instructional workflow rather than an optional supplement, and that distinction determines whether a product gets renewed without deliberation or lands on a spreadsheet of tools under review every budget cycle.
The metrics that surface this value are net revenue retention segmented by integration depth, contract renewal rate by integration tier, and expansion revenue from accounts where integrations are fully live versus partially configured. Gross margins for EdTech platform businesses run in the 82 to 85% range (KeyBanc Capital Markets, "SaaS Survey," 2024). NRR and margin move together when the integration model scales efficiently, and they deteriorate together when it doesn't.
CAC, LTV, and the Onboarding Friction That Distorts Both
EdTech customer acquisition is expensive. According to FirstPageSage's "SaaS CAC and LTV Benchmarks" (2024), average CAC ranges from $806 to $1,617, and the SaaS EdTech benchmark positions CAC at approximately $1,431 against an LTV of $7,100. Every EdTech company I've worked with needs six to fifteen months to recover acquisition cost. When integrations don't activate quickly, the average customer lifespan collapses toward that breakeven window rather than past it.
Integration friction is the hidden accelerant of premature churn. If a product fails to connect to the LMS or SIS within the first weeks of deployment, adoption stalls before the product can demonstrate any value at all. The instructor who can't see grades flow back from the tool will stop using the tool. The administrator who can't reconcile roster data will escalate. By the time the renewal conversation arrives, the product never really got a fair chance, and no amount of account management recovers that lost window.
Tools that integrate cleanly and require minimal setup consistently deliver higher reported ROI. The causal mechanism is time-to-value, not feature depth. A product with fewer features but rapid, clean integration will outperform a feature-rich product that takes months to configure. Feature roadmap conversations should begin with integration readiness rather than end with it.
The metrics that track this dynamic are days from contract signature to first active integration, activation rate at 30, 60, and 90 days segmented by integration completeness, and CAC payback period correlated with onboarding speed. Together, they isolate the contribution of the integration experience to the financial performance of every customer cohort, which is the kind of specificity that separates a defensible ROI argument from a directional one.
User Engagement and Learning Outcome Data That Integrations Make Measurable
One of the less-discussed costs of poor integration is the cost to measurement itself. Without a connected data architecture, vendors can't produce the outcome evidence institutions need to justify renewal internally. The data exists in both the LMS and the SIS, but it's only actionable when it flows between them. Siloed systems produce siloed analyses, practically useless for making a procurement case or a pedagogical one.
Arizona State University's adaptive learning implementation offers a concrete example. According to Arizona State University's "Adaptive Learning Impact Report" (2023), the program documented a 90% passing rate compared to 69% with traditional instructional methods, a 21-percentage-point improvement. That result is measurable only because SIS, LMS, and assessment data were integrated into a single reporting stream. Without that integration, the outcome is real but undocumentable, and in institutional procurement terms, undocumentable is functionally equivalent to nonexistent.
As of 2024, 67% of EdTech companies were integrating AI or machine learning into their platforms (HolonIQ, "EdTech Intelligence Report," 2024). Predictive analytics for at-risk student identification, one of the most commercially compelling use cases in the space, depends entirely on unified data streams. A model trained on data from a single siloed system produces predictions that are systematically incomplete. That limitation surfaces at exactly the wrong moment, during a renewal conversation about the product's impact.
The engagement metrics that matter here are DAU/MAU ratios tracked by academic term, assessment score trends correlated with integration activation dates, and faculty-reported time savings on grading and rostering tasks. Vendors who can populate a customer dashboard with these numbers are constructing the internal renewal argument for their own product. The data architecture is doing commercial work, not just operational work.
NPS, Support Load, and the Early Signals That Predict Churn Before It Happens
Churn rarely arrives without warning. The signals are present. Most vendors simply aren't looking at the right data sources to catch them.
Integration-related support tickets are among the most reliable leading indicators of an at-risk account. A spike in tickets about grade passback failures, roster sync errors, or SSO breakdowns typically precedes a churn event by months, well before a renewal decision surfaces on anyone's calendar. According to Forrester Research's "The ROI of Customer Analytics" (2024), analytics companies integrating NPS with product telemetry reduced churn by an average of 20% through proactive rather than reactive intervention. That's a meaningful effect, representing the difference between retaining an account and writing a post-mortem.
According to CoSN's "EdTech Adoption and Support Survey" (2024), institutions spending less than 30% of their technology budget on training and support see adoption rates below 45%. Integration support isn't overhead to be minimized. It's a churn-prevention lever, and it should be funded and tracked as one.
The metrics that operationalize this are support ticket volume and category by integration type, NPS segmented by integration health status, and time-to-resolution for integration-related issues versus product issues. Proactive outreach tied to specific integration milestones, the first successful grade sync for instance, consistently outperforms reactive support in both adoption rates and renewal outcomes.
Compliance Costs as Integration ROI Line Items That Most Vendors Don't Account For
Compliance is where the integration ROI conversation gets urgent fast. As of 2025, more than 121 state laws protect student privacy beyond FERPA (Future of Privacy Forum, "Student Privacy State Law Tracker," 2025). According to Common Sense Media's "The State of EdTech Privacy" (2024), 96% of EdTech applications share student data with third parties, a practice that creates real exposure under COPPA and FERPA. These aren't edge cases. They describe the baseline operating environment for every vendor I've encountered in this market.
The financial exposure is specific. COPPA violations carry civil penalties of up to $51,744 per violation (FTC, COPPA Rule, 16 C.F.R. Part 312). A data breach in education costs an average of $4.45 million per incident (IBM, "Cost of a Data Breach Report," 2024). Either event destroys the ROI case for any integration, and in most instances the integration architecture itself is where the exposure originates. That's precisely why it needs to be treated as a compliance asset, not merely a technical one.
Standards-based integration, specifically LTI, OneRoster, and Ed-Fi, governs how student data is exchanged, logged, and audited. A point-to-point custom connector that bypasses standard data governance appears cheaper at the outset. The cost picture changes entirely when legal exposure enters the model, a calculation most vendors avoid running until they're already in a conversation with counsel present.
The ROI metric here is avoided cost: the compliance review hours, legal exposure, and potential penalty exposure that a properly architected integration prevents. Compliance maintenance overhead belongs in integration cost models as a recurring line item alongside engineering hours and support costs. It is not a hypothetical. It is a probability with a dollar value attached, and treating it as such changes the investment calculus.
Building an Integration ROI Dashboard That Institutional Buyers and Internal Teams Can Both Use
The final challenge is translation. Vendors must make integration ROI legible to two audiences simultaneously: internal product and finance teams who need to justify investment in integration infrastructure, and institutional buyers who need to justify renewal to their own procurement and academic leadership. These audiences use different vocabularies, carry different pressures, and respond to different framings. The underlying reality they're both trying to understand is the same.
For institutional buyers, best practice involves developing three to five measurable outcomes per tool and tracking them in a usage-versus-cost dashboard, with an annual EdTech value assessment across the full stack. The Kirkpatrick Model offers a structure vendors can mirror in their own customer reporting: Reaction (satisfaction and NPS), Learning (outcome improvements), and Behavior (workflow changes such as grade passback adoption). Framing vendor ROI reports in that language maps directly to how institutional buyers already think about program evaluation, removing a translation burden they didn't ask to carry and positioning the vendor as a partner in the institution's own measurement practice.
On the vendor side, the dashboard should track time-to-first-integration by customer cohort, NRR segmented by integration depth, support ticket trends by connector type, CAC payback period correlated with integration activation date, and compliance incident rate. According to EDUCAUSE's "Measuring the Value of EdTech Investments" (2024), EDUCAUSE has reported EdTech ROI ratios of 3:1 to 5:1 when institutions apply comprehensive measurement frameworks. Vendors who help their customers achieve and document those ratios get renewed not because they made a compelling pitch, but because they made the value visible.
Standard version upgrades, API deprecations, and state reporting requirement changes don't pause between contract cycles. The operational burden of keeping integrations current is ongoing, and it belongs to the vendor. Vendors who treat integration maintenance as a product responsibility rather than a customer problem convert that burden into a retention argument. Vendors who fail to do so will eventually find themselves explaining, at the worst possible moment, why the roster sync broke two weeks before a renewal decision.