Prioritizing Integration Features in an EdTech Product Backlog

The first question a school district asks about your EdTech product is almost never "what does it do?" It's "does it work with our LMS?" If the answer is anything other than a clean yes, the conversation is effectively over. That's the reality integration prioritization has to be built around. Not feature parity, not UI polish. The integration question comes first, and how your team answers it — and in what order you build toward that answer — determines whether your product gets used or sits in a district's graveyard of well-intentioned software purchases.
The Integration Landscape You Actually Inherit
You enter a district already running more than 200 EdTech tools, not a blank slate, and your job isn't to introduce them to integrations., it's to fit into the ecosystem they already have.
Three technical standards define most of that ecosystem.
SCORM handles packaged learning content. It's legacy-compatible, universally supported, and the default expectation for compliance training and self-hosted content.
LTI 1.3 connects external tools to the LMS with secure authentication and grade passback. LTI 1.1 was deprecated in June 2022 — if your team is still discussing 1.1, that's a technical debt conversation you need immediately. Two companion services inside LTI 1.3 that teams routinely underestimate: Names and Role Provisioning Services (NRPS), which deliver class rosters, and Assignment and Grade Services (AGS), which write scores directly into the gradebook.
xAPI (Tin Can) captures learning activity data across any surface — mobile, offline, VR, simulators. It's the right choice when measurement is your product's core value proposition.
Most enterprise EdTech products need at least two of these three. The choice isn't which standard is best in the abstract. It's which jobs your product needs to do.
For K-12, there's a rostering layer on top. Clever and ClassLink dominate that space, both built on the OneRoster standard. A substantial majority of U.S. districts run OneRoster-compliant SIS platforms, meaning a single OneRoster integration covers most of your K-12 addressable market. That's a strategic shortcut hiding in plain sight.
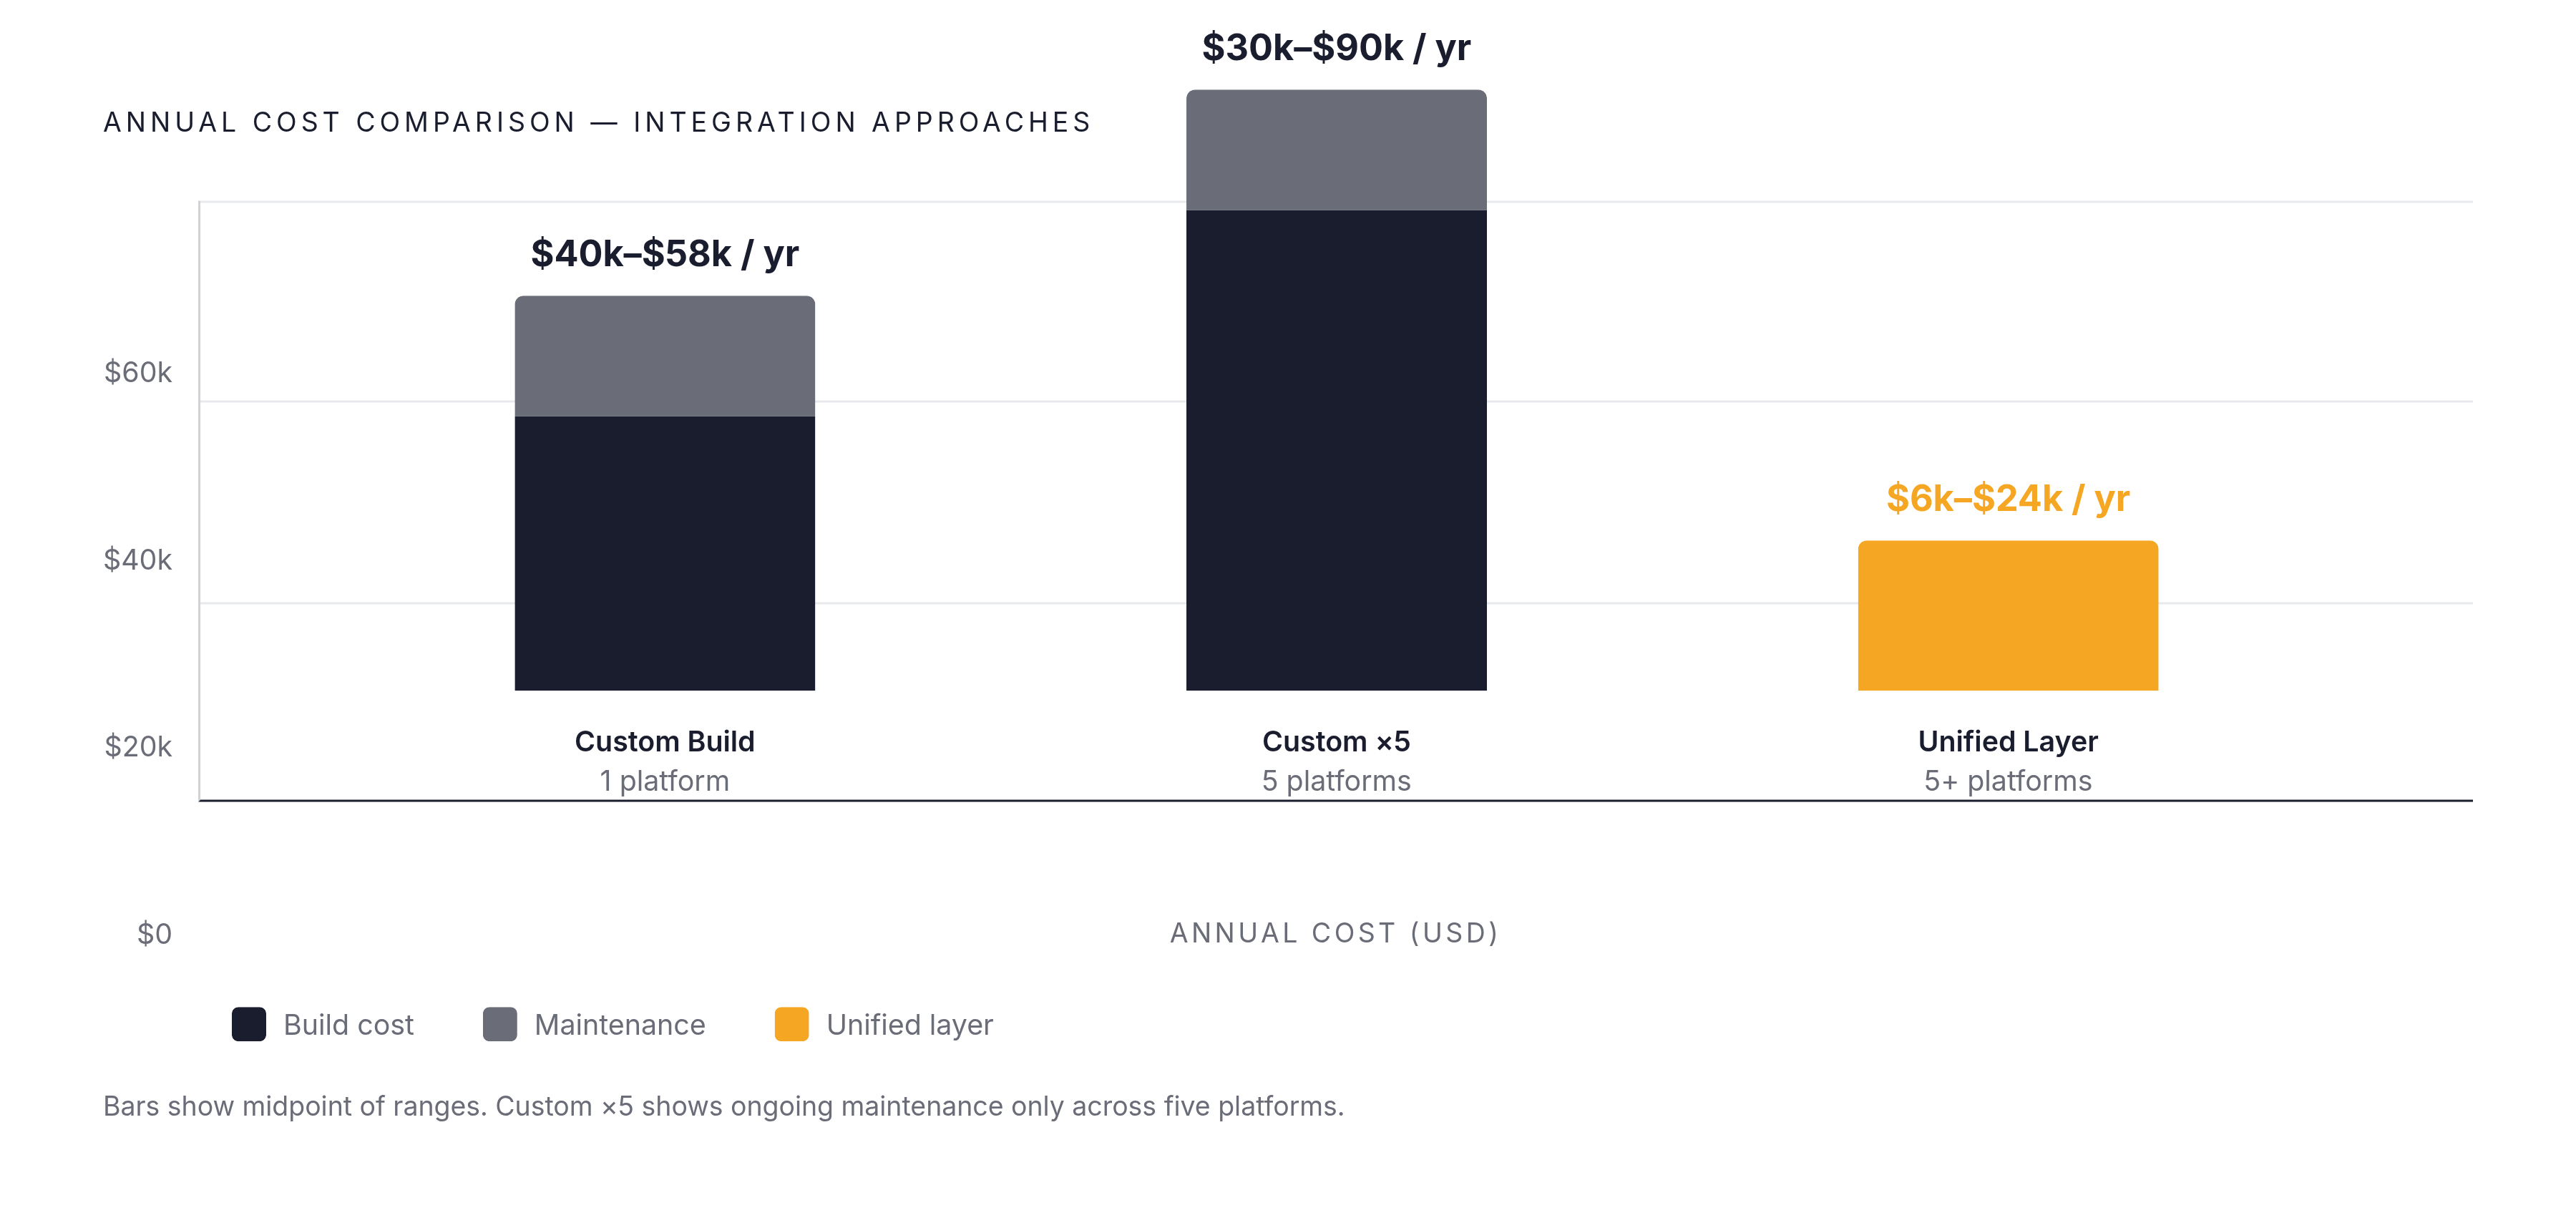
Cost reality forces every prioritization conversation. A custom single-LMS integration runs $15,000–$40,000 to build and $500–$1,500 per month to maintain. A unified integration layer covering five or more LMS platforms typically runs $500–$2,000 per month. "Build every integration" stops being a strategy and starts being a budget crisis fast. Budget for SIS data complexity too — incomplete records and inconsistent field names are expected work, not edge cases.
Why Integration Tickets Are Different
Standard feature work has a build-once profile. You ship it, you move on. Integrations don't work that way.
Every LMS API update can break an existing connector. Maintenance cost isn't optional overhead — it's a permanent line item that belongs in the effort score from day one. Teams that score integration effort as "initial build hours" routinely under-resource maintenance, then act surprised when things break six months later.
The other distinction is the deal-gate function. A missing feature reduces satisfaction. A missing integration can end a sales cycle entirely. Those aren't the same category of problem and shouldn't be scored the same way.
Integrations also carry compliance dependencies most feature work doesn't. The moment your product passes data through an integration, FERPA, COPPA, and state privacy laws become your problem. That compliance readiness belongs in the effort score. Integration debt compounds faster than most feature debt because the APIs it depends on change externally, outside your control.
The "system of record" decision also shapes which integrations matter most. If your product treats the LMS as the source of truth, you prioritize SCORM and LTI grade passback. If your product is analytics-centric, xAPI and a learning record store take priority. That choice has downstream consequences lasting years.
Applying Prioritization Frameworks to Integrations
The frameworks you already know mostly work. They just need integration-specific adjustments.
RICE (Reach, Impact, Confidence, Effort) is a solid default for comparing integration options or weighing them against core features competing for the same sprint.
Reach means how many paying or target accounts use this LMS or SIS — not total end-users.
Impact means does this unlock a new segment or deepen retention in one you already have?
Confidence means has the LMS vendor confirmed API stability? A certified partner program is worth more than a "probably won't change" promise.
Effort must include ongoing maintenance cost, not just initial build hours.
WSJF (Weighted Shortest Job First) is Cost of Delay divided by job size. It's powerful when an integration is blocking an active deal, because the cost of delay becomes concrete — there's a real contract value at risk. Quantifying that number forces sales and product into an honest conversation about what a delayed roadmap item actually costs versus a lost deal.
MoSCoW is useful in cross-functional settings with curriculum leads or district champions in the room. The caution: MoSCoW inflates the Must-Have bucket when applied to integrations, almost every time. Every integration feels must-have to the stakeholder whose LMS it covers. Put a hard cap on Must-Haves and hold it.
The practical pattern is RICE or WSJF for numerical ranking, MoSCoW for stakeholder alignment, and a Value/Effort matrix for visual roadmap communication. Use them together, not in isolation.
Scoring Dimensions Standard Frameworks Miss
Standard RICE doesn't know what Canvas is. It doesn't know LTI 1.1 is deprecated. It doesn't know a OneRoster integration covers most of K-12. You have to add that context manually.
Buyer segment concentration. Weight integrations that unlock the largest addressable sub-market first. Canvas, Moodle, Blackboard, Brightspace, and Google Classroom hold most institutional rosters. Any integration covering more than one of these through a shared standard deserves a score multiplier.
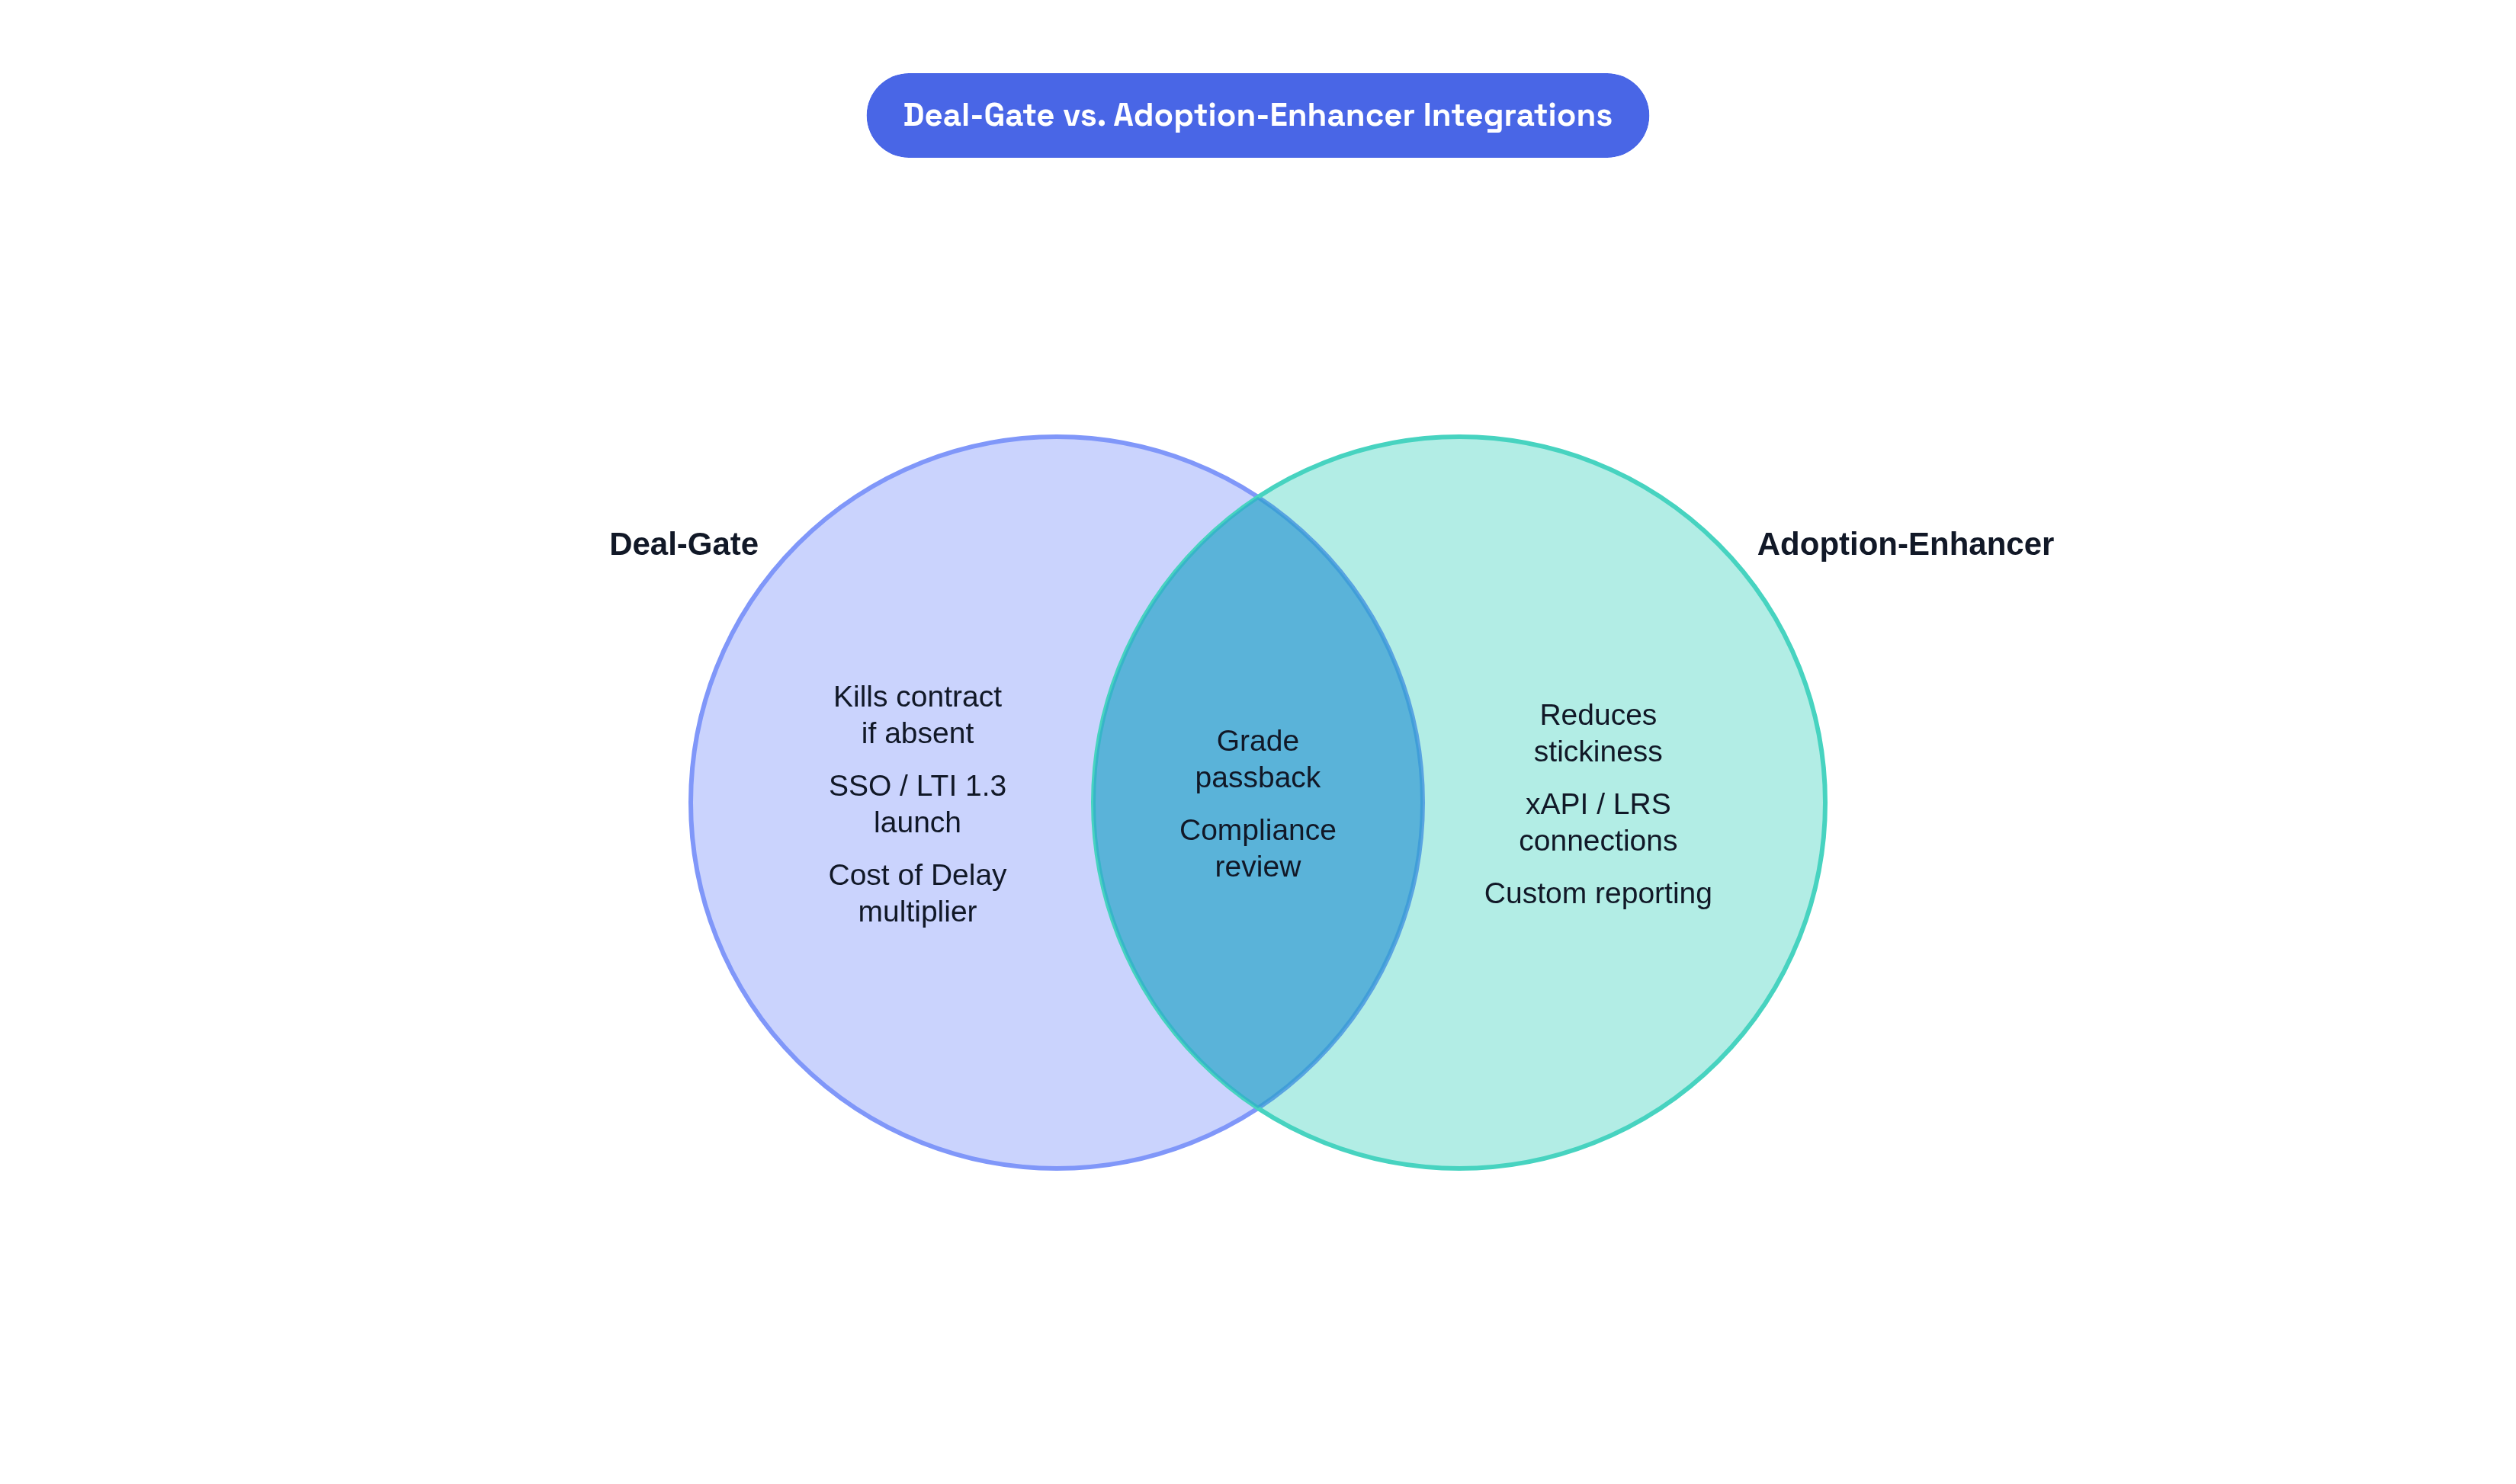
Deal-gate vs. adoption-enhancer is the most important distinction your scoring model needs.
A deal-gate is an integration whose absence kills the contract. SSO, LTI launch, and grade passback for gradebook-dependent buyers are deal-gates.
An adoption-enhancer is an integration whose absence reduces stickiness but doesn't block the sale. Advanced analytics and xAPI LRS connections are adoption-enhancers.
Deal-gates should carry a multiplier on Cost of Delay and belong in a different priority tier regardless of effort required.
Maintenance as a first-class input. Score effort as a 12-month cost figure. Initial dev hours are a starting point, not a final answer. The total-cost-of-ownership difference between a custom connector and a managed integration layer is substantial.
Standards compliance as an effort modifier. An integration built on LTI 1.3 or OneRoster carries lower long-term effort than a proprietary API. Anything still running on LTI 1.1 should carry a debt penalty in the effort score. Build that in now — don't let it surprise you later.
Apply the 80/20 lens explicitly: LTI 1.3 plus SSO plus grade passback for your top one or two LMS platforms likely covers the majority of buyer requirements. Resist building the long tail before you have validated demand from real accounts.
Compliance Is a Prioritization Gate
FERPA, COPPA, and state privacy laws don't layer neatly — they converge on data-passing integrations specifically. The U.S. Department of Education introduced mandatory state-level FERPA certifications in March 2025, making compliance a prerequisite for funding eligibility, not just a procurement checkbox. FTC COPPA amendments effective June 23, 2025 explicitly add biometric and government-issued identifiers to protected information — any integration passing student identity data needs review against the revised rule before it ships.
More than 120 state privacy laws are in effect as of 2026, including California's SOPIPA, New York's Ed Tech Privacy Law, and Texas's Student Data Bill of Rights. The education sector averaged more than 4,300 cyberattacks per organization per week in Q2 2025, up 31% year-over-year, with third-party vendors responsible for the majority of breaches. The December 2024 PowerSchool breach, exposing demographic data and grades across many districts, is the example everyone in EdTech has been watching.
Rather than treating FERPA, COPPA, and GDPR as three separate checklists, focus on their common principles: purpose limitation, data minimization, transparency, security, and accountability. Build toward those and you'll be better positioned across all three simultaneously.
Practically: any integration passing student PII requires compliance review before entering a sprint. Data minimization is both a compliance strategy and a speed advantage — grade passback only, no raw demographic data, is a much faster compliance conversation than pulling full student profiles.
The MVP Integration Sequence
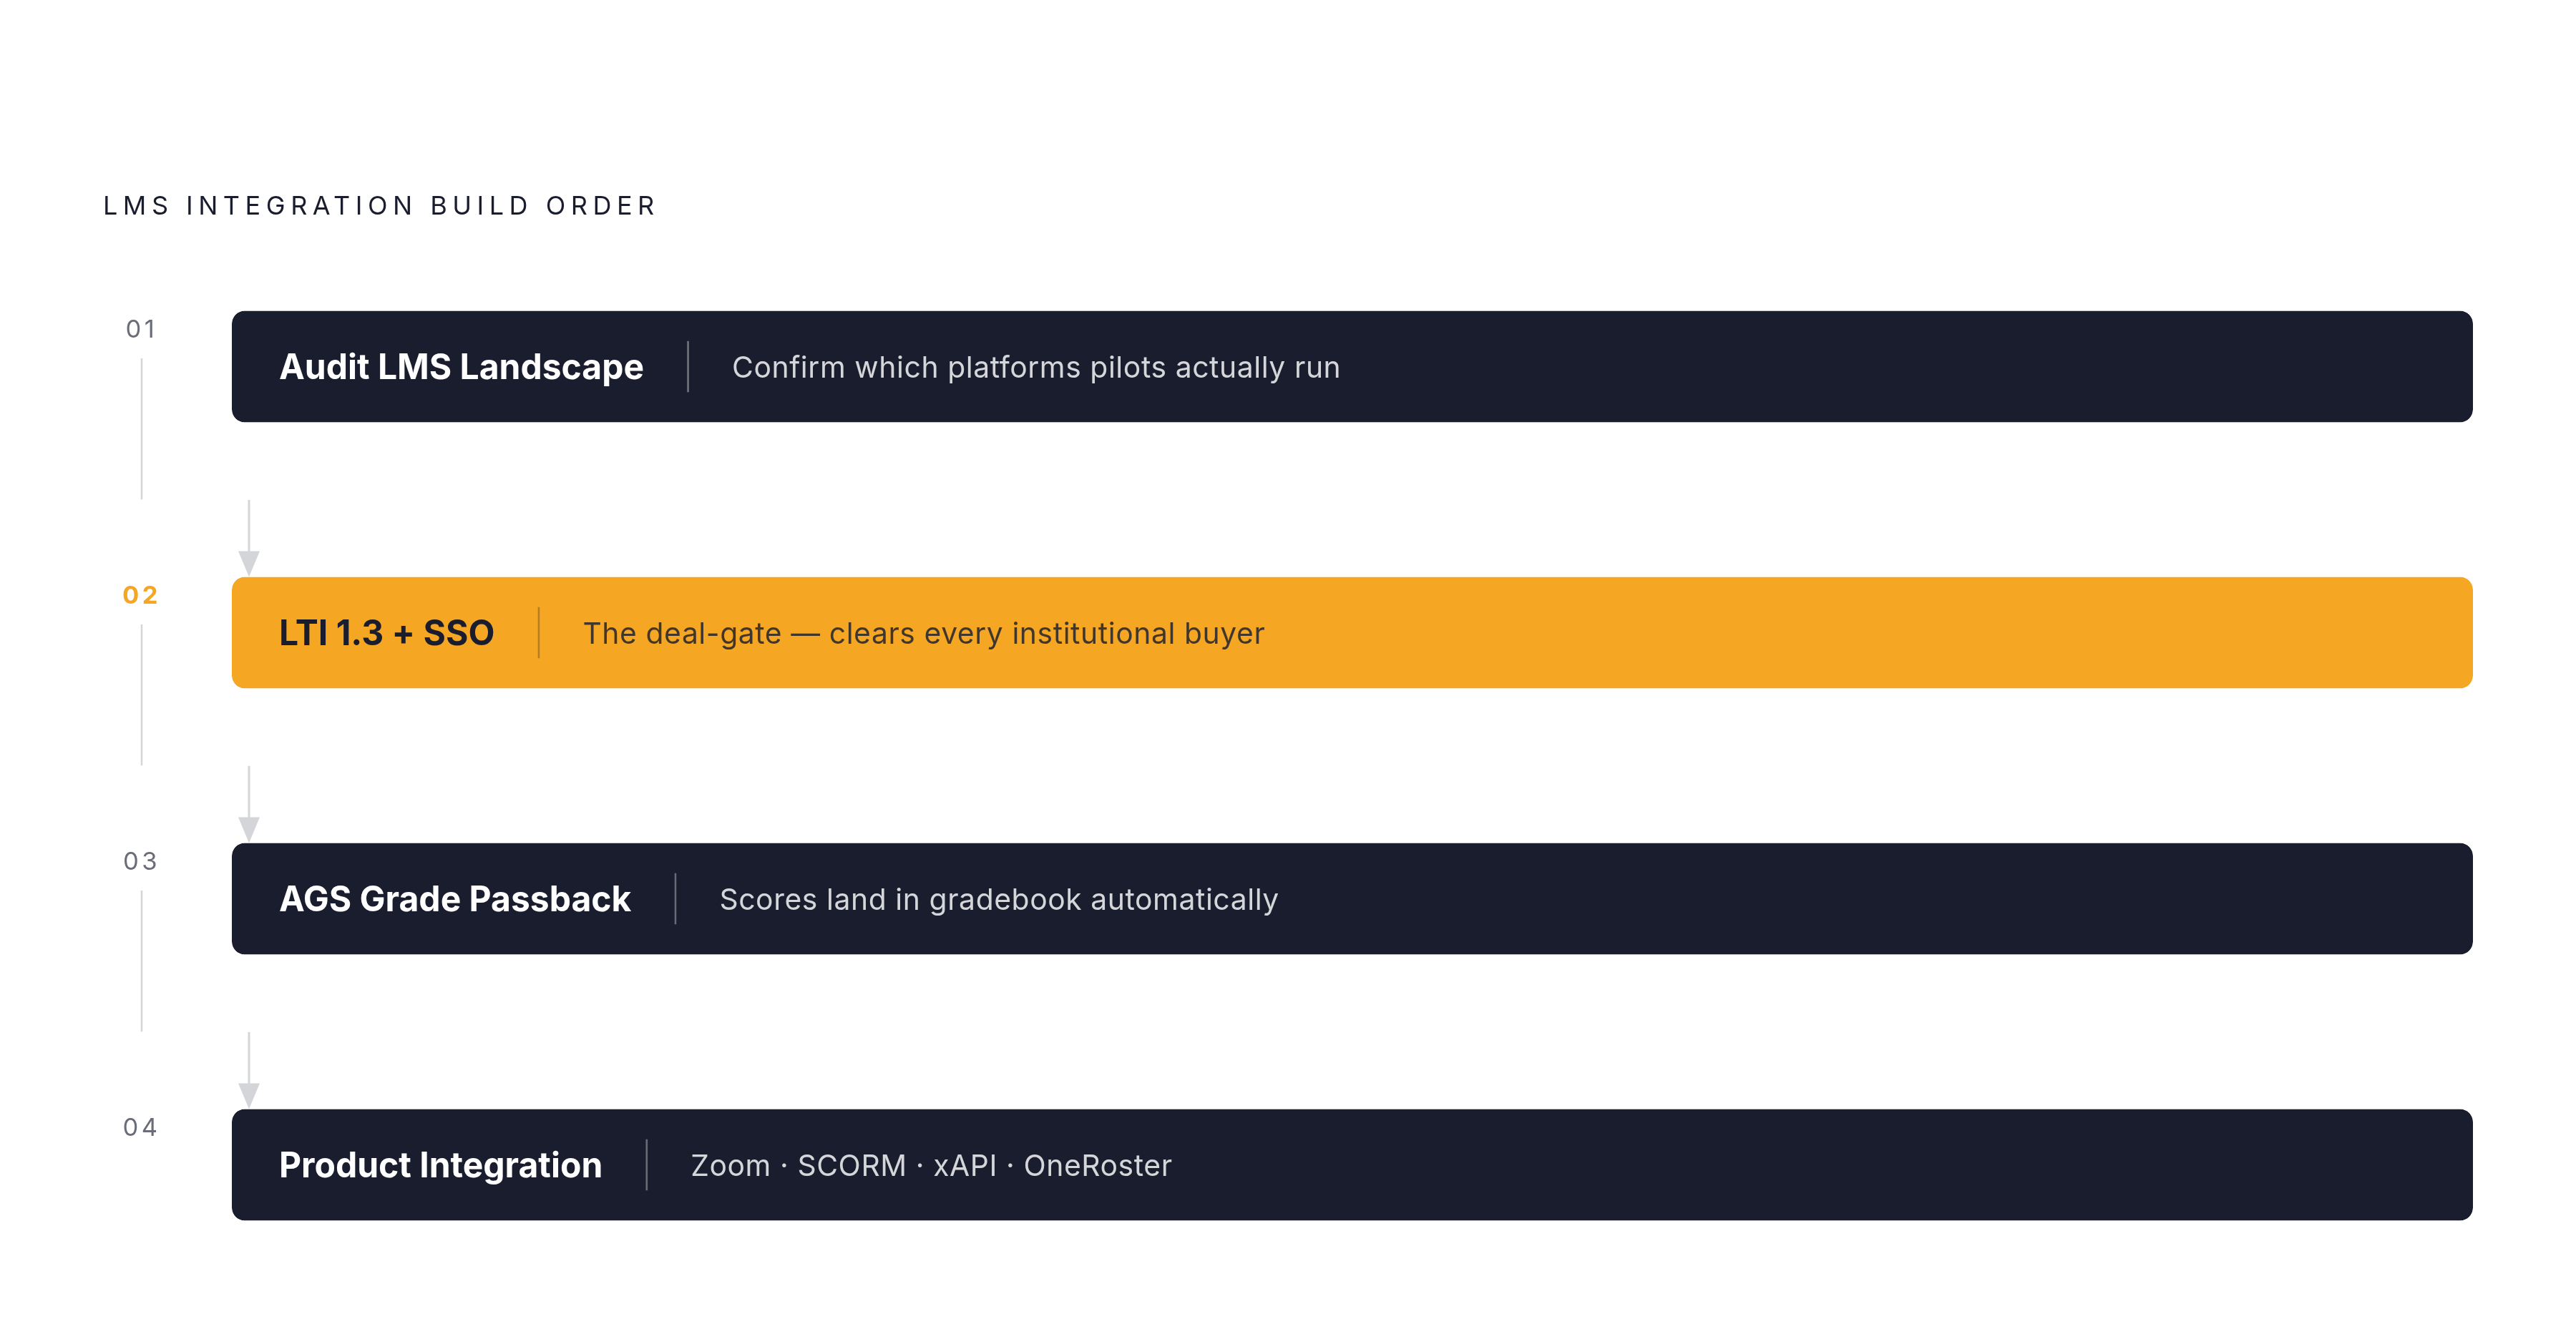
This sequence has one goal: the shortest path to a buyer saying yes.
Step 1: Confirm which LMS your pilot customers actually run. Standardize on it before building anything. Many teams skip this and build for the LMS they know best, not the one their buyers use.
Step 2: Implement LTI 1.3 launch and SSO. Students reach your tool in one click. Teachers don't manage separate logins. This is the deal-gate for most institutional buyers and the foundation everything else sits on.
Step 3: Add AGS grade passback. Scores land in the gradebook automatically. The manual-entry objection — a real and consistent one — disappears. Teacher adoption follows.
Step 4: Layer on the integration your product specifically depends on. Zoom for live-class products. SCORM export if buyers want to self-host content. xAPI if measurement is your core value proposition. For K-12 products targeting broad district coverage, a OneRoster integration via Clever or ClassLink at this step is more efficient than building individual SIS connectors.
Everything else waits for validated demand from real accounts. One important process note: a significant majority of PMs participate in user research, but only about a quarter of tech leads do. Integration sequencing decisions made without engineering input routinely underestimate maintenance cost and overestimate build speed. Involve tech leads in scoring integration effort from the first pass.
Integration Quality Drives Retention and Revenue
Implementation abandonment is the specific churn risk EdTech companies don't always name clearly. The platform is technically adopted, procurement happened, but it's never meaningfully used. This is most common when integration setup is burdensome or incomplete — think of buying a gym membership and leaving the shoes in the bag. The contract exists, but the value never does.
Strong benchmarks are under 2% monthly churn for SMB-focused products and under 1% for enterprise. Integration friction is a direct driver of sitting above those benchmarks. A teacher who manually entered grades for six weeks is not renewing in the spring.
Investors as of Q4 2025 are concentrating capital on companies showing net revenue retention above 110% and implementation payback within roughly 12 months. A frictionless integration experience shortens time-to-value and compresses that payback period. Infrastructure and interoperability plays commanded a median valuation multiple of roughly 18.6x revenue in Q4 2025, compared to a broader market median of roughly 7.8x. Integration depth is a valuation signal.
Integrations that reduce teacher setup time and eliminate manual grade entry generate retention value that doesn't show up in feature comparisons or demos. It shows up in renewal rates, expansion conversations, and the "our teachers actually use it" testimonials that move future deals. Prioritize accordingly.